Model Comprehension Version one
This project goal is to take diagrams and find how visual dense the diagram is, using computer vision techniques like open_cv.
Model Comprehension Version one
Summary
This project is part of a larger research effort focused on model comprehension — specifically, understanding what makes a good UML diagram. As part of this research, we analyzed over 700 diagrams across a variety of metrics, one of the most important being model density.
Manually calculating model density for that many diagrams would have been completely impractical. That’s when I suggested building a program that could quickly, reliably, and consistently measure density for us. From there, this project was born. The program I developed uses a variety of techniques, with the main ones in this version being the OpenCV library, along with two clustering methods: K-means and Voronoi tessellation. I spent about three weeks deep in research, development, and bug-fixing — working to create something robust and reliable — before I had to head back to school.
Design and Solution
The general idea behind the program I needed was to find the center points of nodes or boxes in a UML diagram. While doing this manually wasn’t difficult, it was certainly time-consuming. Ideally, I wanted the program to produce results similar to the manual method, like the image below.
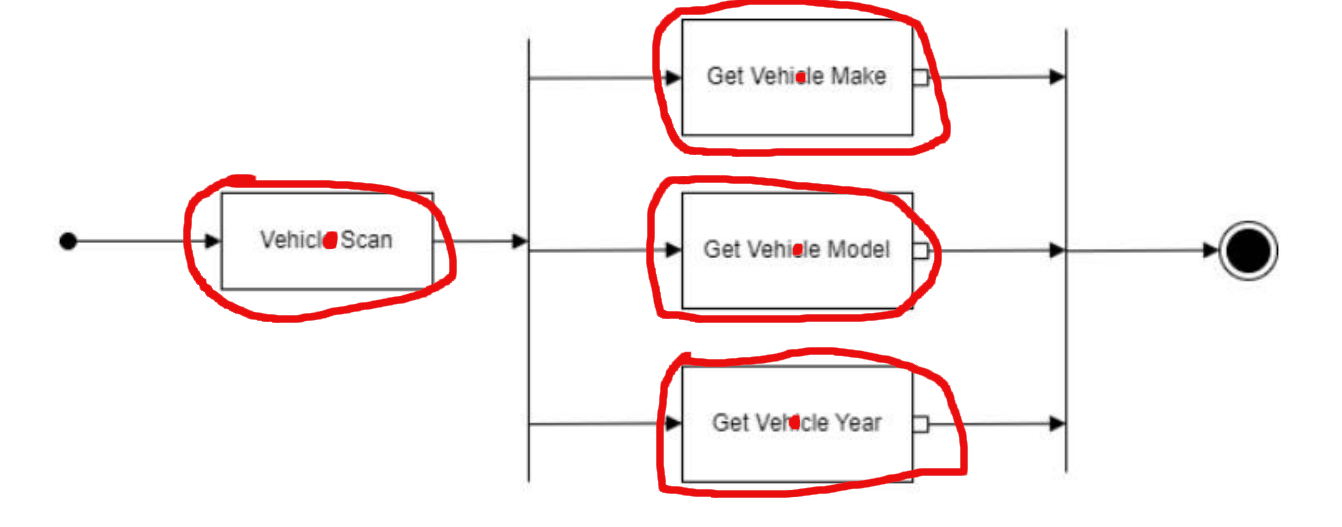 This is what I would want the program to display when finding the boxes/nodes
My plan was to use OpenCV’s contour-finding method, combined with a Voronoi tessellation technique. The OpenCV method would identify the center points of the boxes, and then the program would cluster these points using the Voronoi tessellation. Afterward, it would calculate the geographic center of each Voronoi region and compute the Euclidean distance in pixels between them. Finally, the program would average these distances and determine the standard deviation.
This approach would allow us to measure the density of diagrams in a fast, reliable, and consistent manner. However, as von Moltke famously said, “No plan survives contact with the enemy”—or in this case, “No design survives implementation.”
Implementation / Main Problems
The Rabbit Hole of Bug Fixing
There were a series of issues that, unfortunately, seemed to compound one another. Fixing one problem would often lead to another, and I found myself spiraling down a rabbit hole of constant bug fixes. The main challenges I faced were the tight time constraints and my limited knowledge of how to fully leverage OpenCV and the various methods and techniques it offers. While the plan to use OpenCV seemed sound, the implementation turned out to be much more difficult than expected. Since many of the boxes and text elements were connected by lines or other components, OpenCV struggled to detect the text and boxes. It often ended up identifying multiple center points that were either nested inside each other or completely off the mark. In this case, OpenCV proved to be generally unreliable and inconsistent. This issue became the primary source of my frustration throughout the development process. Eventually, I did manage to solve this problem eventually—but not in this version of the program.
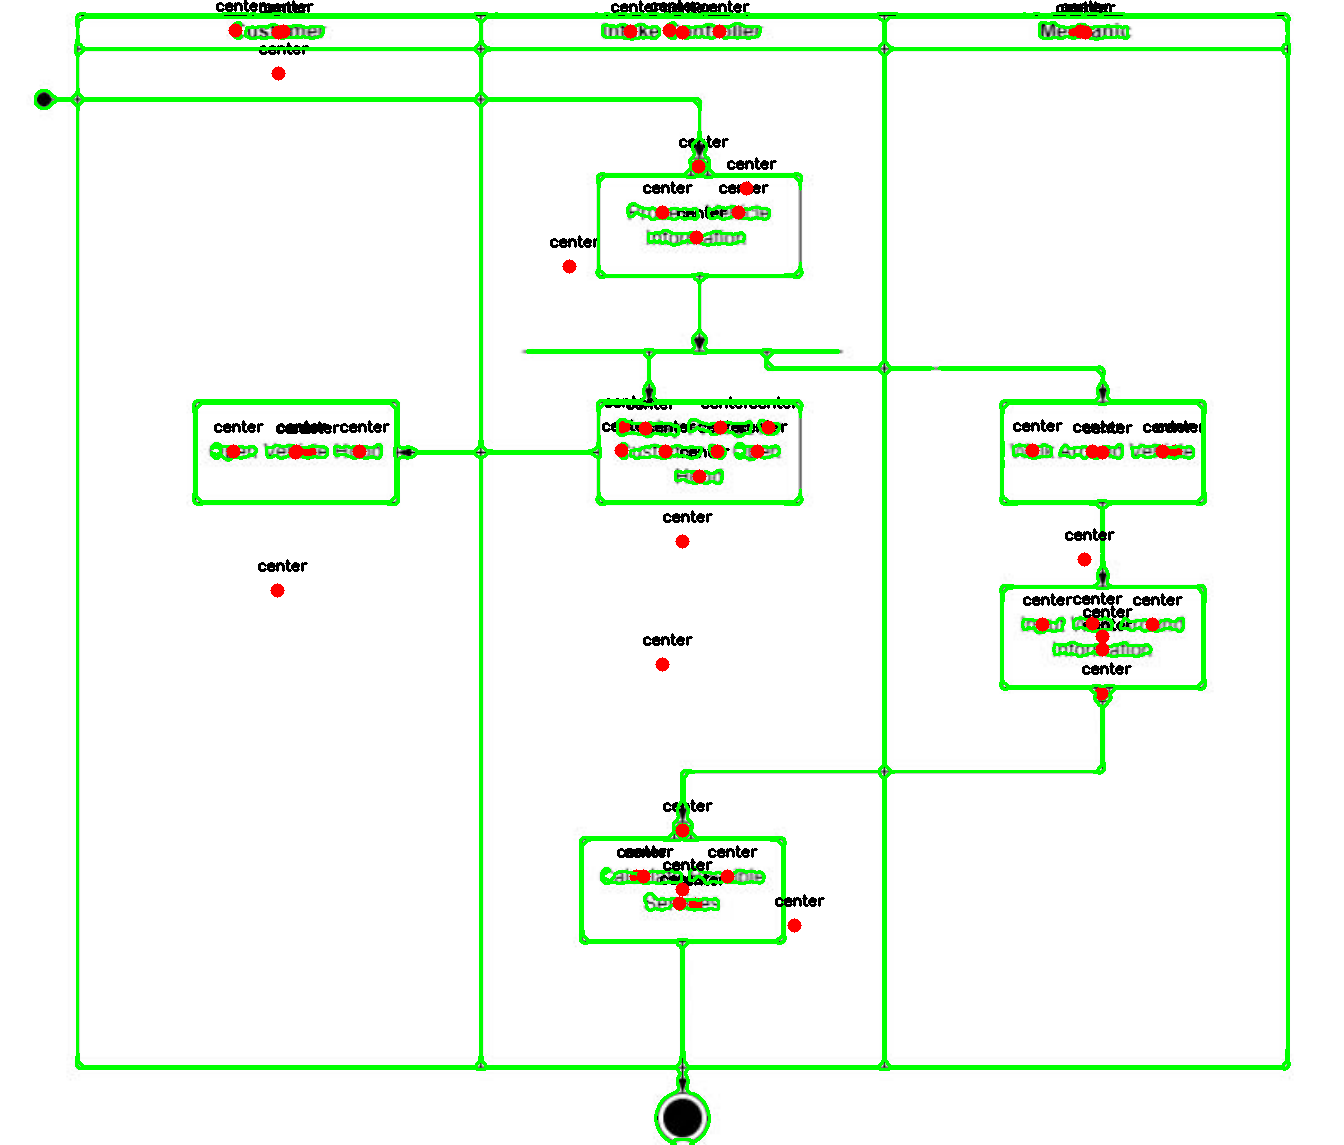 This is what the find contour got even after fine-tuning
Another challenge came from some initial assumptions I had made, as well as lingering issues from OpenCV. The method often generated center points that were either nonsensical, in large quantities, or both. To address this, I felt it was necessary to cluster the points in an attempt to filter out the noise and improve the data quality. I decided to use K-means clustering, as I knew the number of clusters I needed and hoped it would yield better results. However, this choice wasn’t perfect. K-means is inherently inconsistent, and the resulting clusters often varied significantly from one run to the next. Also, the k-means required outside information that limited the programs actual use with any diagrams not already inside our testing set.
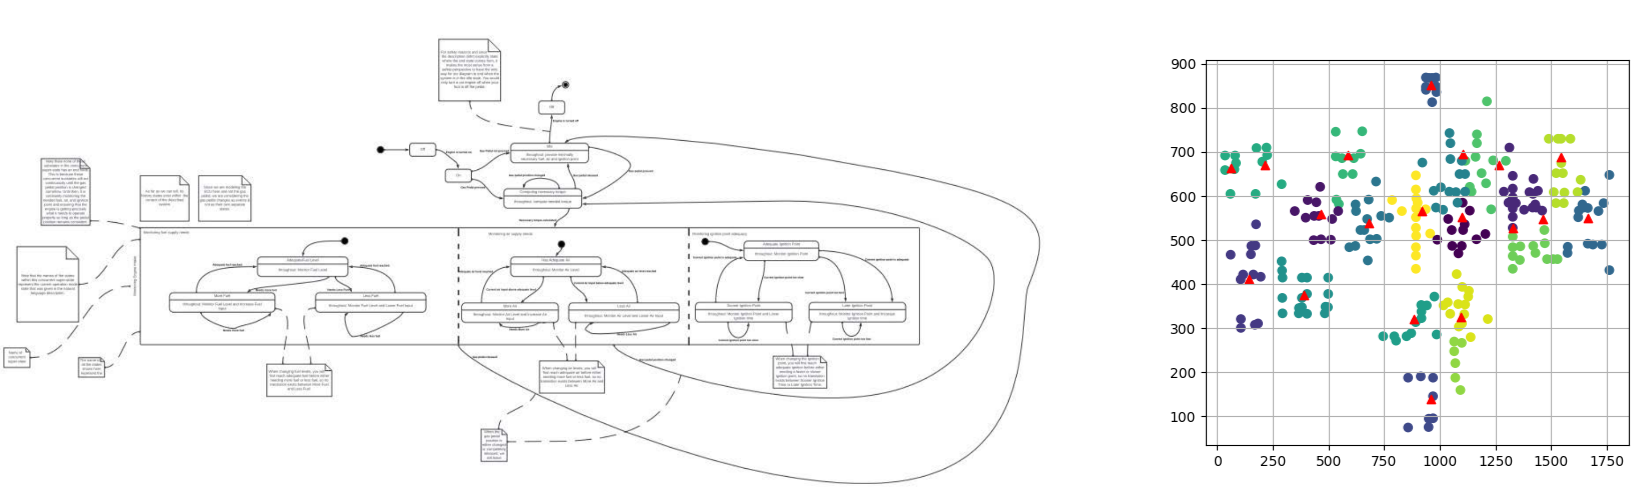 This is a base diagram and its corresponding k-means cluster with the triangles being center points on the cluster graph
Refining the Data with Voronoi Tessellation I then took the center points from the K-means clustering and applied a Voronoi tessellation method to further refine the data. The goal was to filter out bad data and pinpoint the broader regions of the diagram. These final center points were then used to calculate the average distance and standard deviation. But another issue emerged: the Voronoi tessellation method often produced terrible results, frequently returning graphs or data with only a single point—or, in the worst case, no points at all. This problem eluded me for quite some time, and it became the most frustrating aspect of the project. After agonizing over it for days, I had to ultimately admit defeat and end my work on the program due to running out of time.
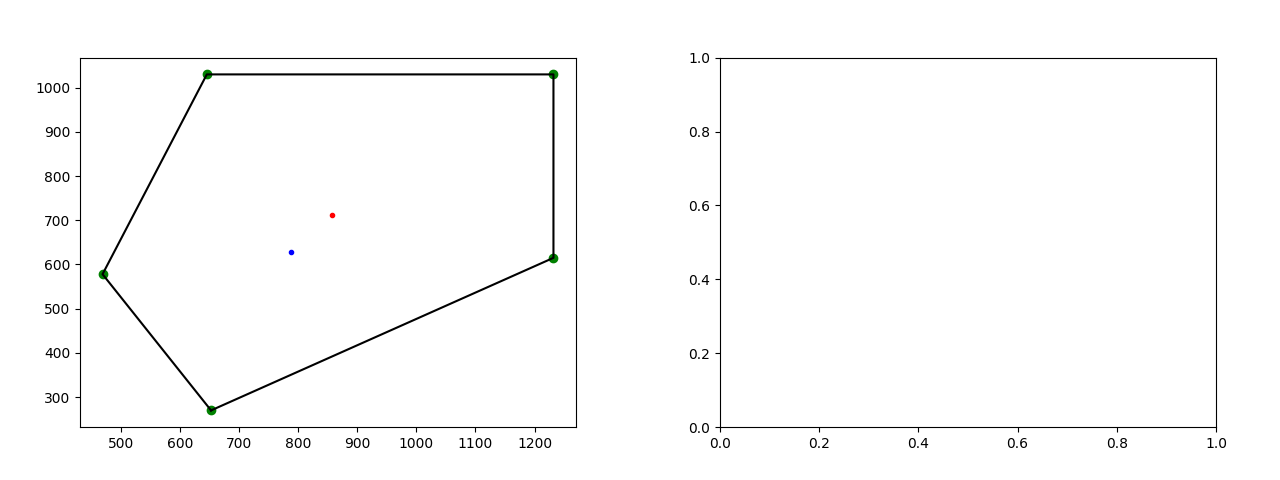 A example of a bad voronoi outputs with just one point no points, this occurred 154 times
Overall this program suffered from many issues with the biggest being open_cv unreliability in finding nodes and boxes of our diagrams. Then the voronoi tesselation method often failing or producing terrible data with a staggering 22% of all 700 diagrams failing to produce adequate or usable data. This means 154 of our diagrams either had bad data or no data at all mostly due to this single method. Also, the fact that this fault illuded me, and me ultimately running out of time was frustrating.
The Final Outcome
In the end, this program faced numerous challenges, with the most significant being OpenCV’s unreliability in detecting nodes and boxes within the diagrams. Additionally, the Voronoi tessellation method frequently failed, yielding unusable or incorrect data in a staggering 22% of the 700 diagrams—meaning 154 diagrams either had faulty data or no data at all, primarily because of this one method. To make matters worse, the fact that this issue eluded me for so long, combined with the limited time I had, was incredibly frustrating.
Step-by-step process
- For every pdf file, create a png
- The program then converts the png to grayscale applies and a gaussian blur
- The program then applies an opencv invert binary threshold
- The program then applies an open cv method for finding the contours of the png and finds the center points of these contours.
- The program then uses the center points in a K-means cluster algorithm to reduce the number of center points and find new center points of the clusters.
- The program then uses the k-means center points to create a Voronoi tessellation method.
- The program then finds the center points of the Voronoi tessellation clusters
- The program then uses the Voronoi center points and calculates the average distance and standard deviation of the average distance.
Conclusion
This project ended up being a series of compromises and best-possible solutions given the strict time constraints. Despite the challenges, we managed to produce some usable data and establish a solid starting point for future development, both in terms of research and the program itself.
That said, the program had serious flaws, particularly with the OpenCV methods and the Voronoi tessellation technique I implemented. These problems weren’t insurmountable—given more time, they could have been solved. Alongside these major issues, there were numerous minor bugs, readability concerns, and a general lack of documentation that would need to be addressed for the program to move forward.
For a while, the project remained in this unfinished state. It sat idle for about three months, until, during my final semester of college, I decided to pick up the mantle once again and see if I could finally fix the program—and turn it into what I had always envisioned.
If you want to see how I fixed this program and what new features I added to it, go to Model Comprehension Version 2