Model Comprehension Version two
This project goal is to take diagrams and find how visual dense the diagram is, using computer vision techniques like OCR and open_cv methods.
Model Comprehension Version 2
This project relates to its predecessor Model Comprehension V1 in that post I cover alot of the background information and purpose of this project. and cover the background and reason why I created this project.
Summary
This project began in the summer of last year with a simple yet ambitious goal: to determine what makes a UML diagram a good UML diagram. What initially seemed like a straightforward question quickly revealed many complex facets. For example, one major consideration was whether a denser or a less dense diagram is more or less effective.
To explore this, we developed an algorithm designed to automatically calculate the density of UML diagrams. It does this by measuring the average pixel distance between key semantic and diagrammatic points, or “points of interest” (POI), across the diagrams. This average distance is also the density of the diagrams.
The current program was built to address many of the shortcomings found in its predecessor. Our main objectives included improving the detection of boxes, nodes, and text within various UML diagrams, as well as fixing any bugs, errors, or issues that surfaced since the initial version.
One major task was correcting the Voronoi tessellation method, which previously struggled to identify an appropriate number of Voronoi regions — sometimes finding only one or none at all. Additionally, we set out to establish a more formal and structured approach to testing, aiming to objectively verify whether the new version outperformed the old.
Finally, we focused on making the updated program more efficient, consistent, and accurate through a combination of code optimizations, thorough documentation, and careful refactoring.
Design and Solutions
At the start of this new version, I took a step back to identify the main issues I wanted to focus on:
- Fix the Voronoi tessellation method (this had been a persistent challenge and my top priority).
- Find better techniques for detecting nodes, boxes, and text within UML diagrams.
- Develop a more robust clustering method that doesn’t rely on background data.
- Fix various bugs and refactor the existing “spaghetti code” into something cleaner and more maintainable.
- Rigorously test Version 2 against Version 1 to ensure we were making real improvements.
This time around, I was fortunate to work alongside a friend who helped immensely with design choices and, crucially, refactoring the code into a more readable and maintainable structure. We made the decision to completely overhaul both our clustering method and our approach to detecting boxes and text.
One major pivot was moving away from OpenCV as our primary library. Instead, we adopted an optical character recognition (OCR) library called PyMuPDF. We also developed a backup method based on OpenCV, but with a vastly improved strategy that was much more capable of detecting boxes and text when OCR failed to extract enough information.
Another key change was switching from K-means clustering to Mean Shift clustering. The main reason for this was that K-means requires prior knowledge of how many clusters to create, while Mean Shift clustering automatically determines the number of clusters needed without any external input — a much more flexible and powerful solution for our needs.
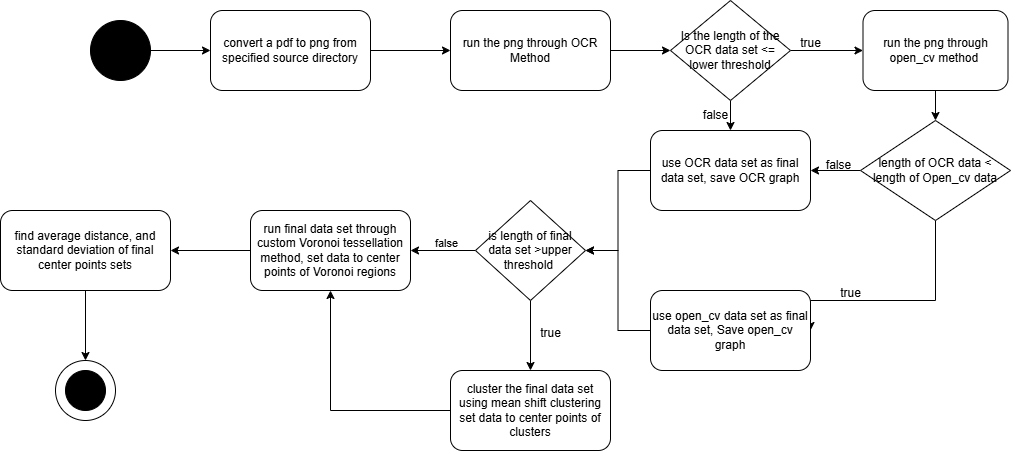
 This is an activity diagram that shows the path that a single png and center point data set takes through the program
Implementation / Main Problems
From Design to Execution: Overcoming Challenges and Refining the Project
After spending a week designing and planning, we set out to tackle our objectives. Initially, we used an OCR library called Simple OCR, based on Pytesseract and PyVision. However, this library had serious memory leaks and extremely high machine requirements — only the most powerful PCs could run it reliably. Because of these limitations, we pivoted to doctr, a much more efficient and faster library that required fewer dependencies (such as CUDA) and significantly less memory and virtual RAM. PyMuPDF also supported the integration of pre-trained models that excelled at recognizing specific types of text and characters, making it a massive improvement over our initial setup.
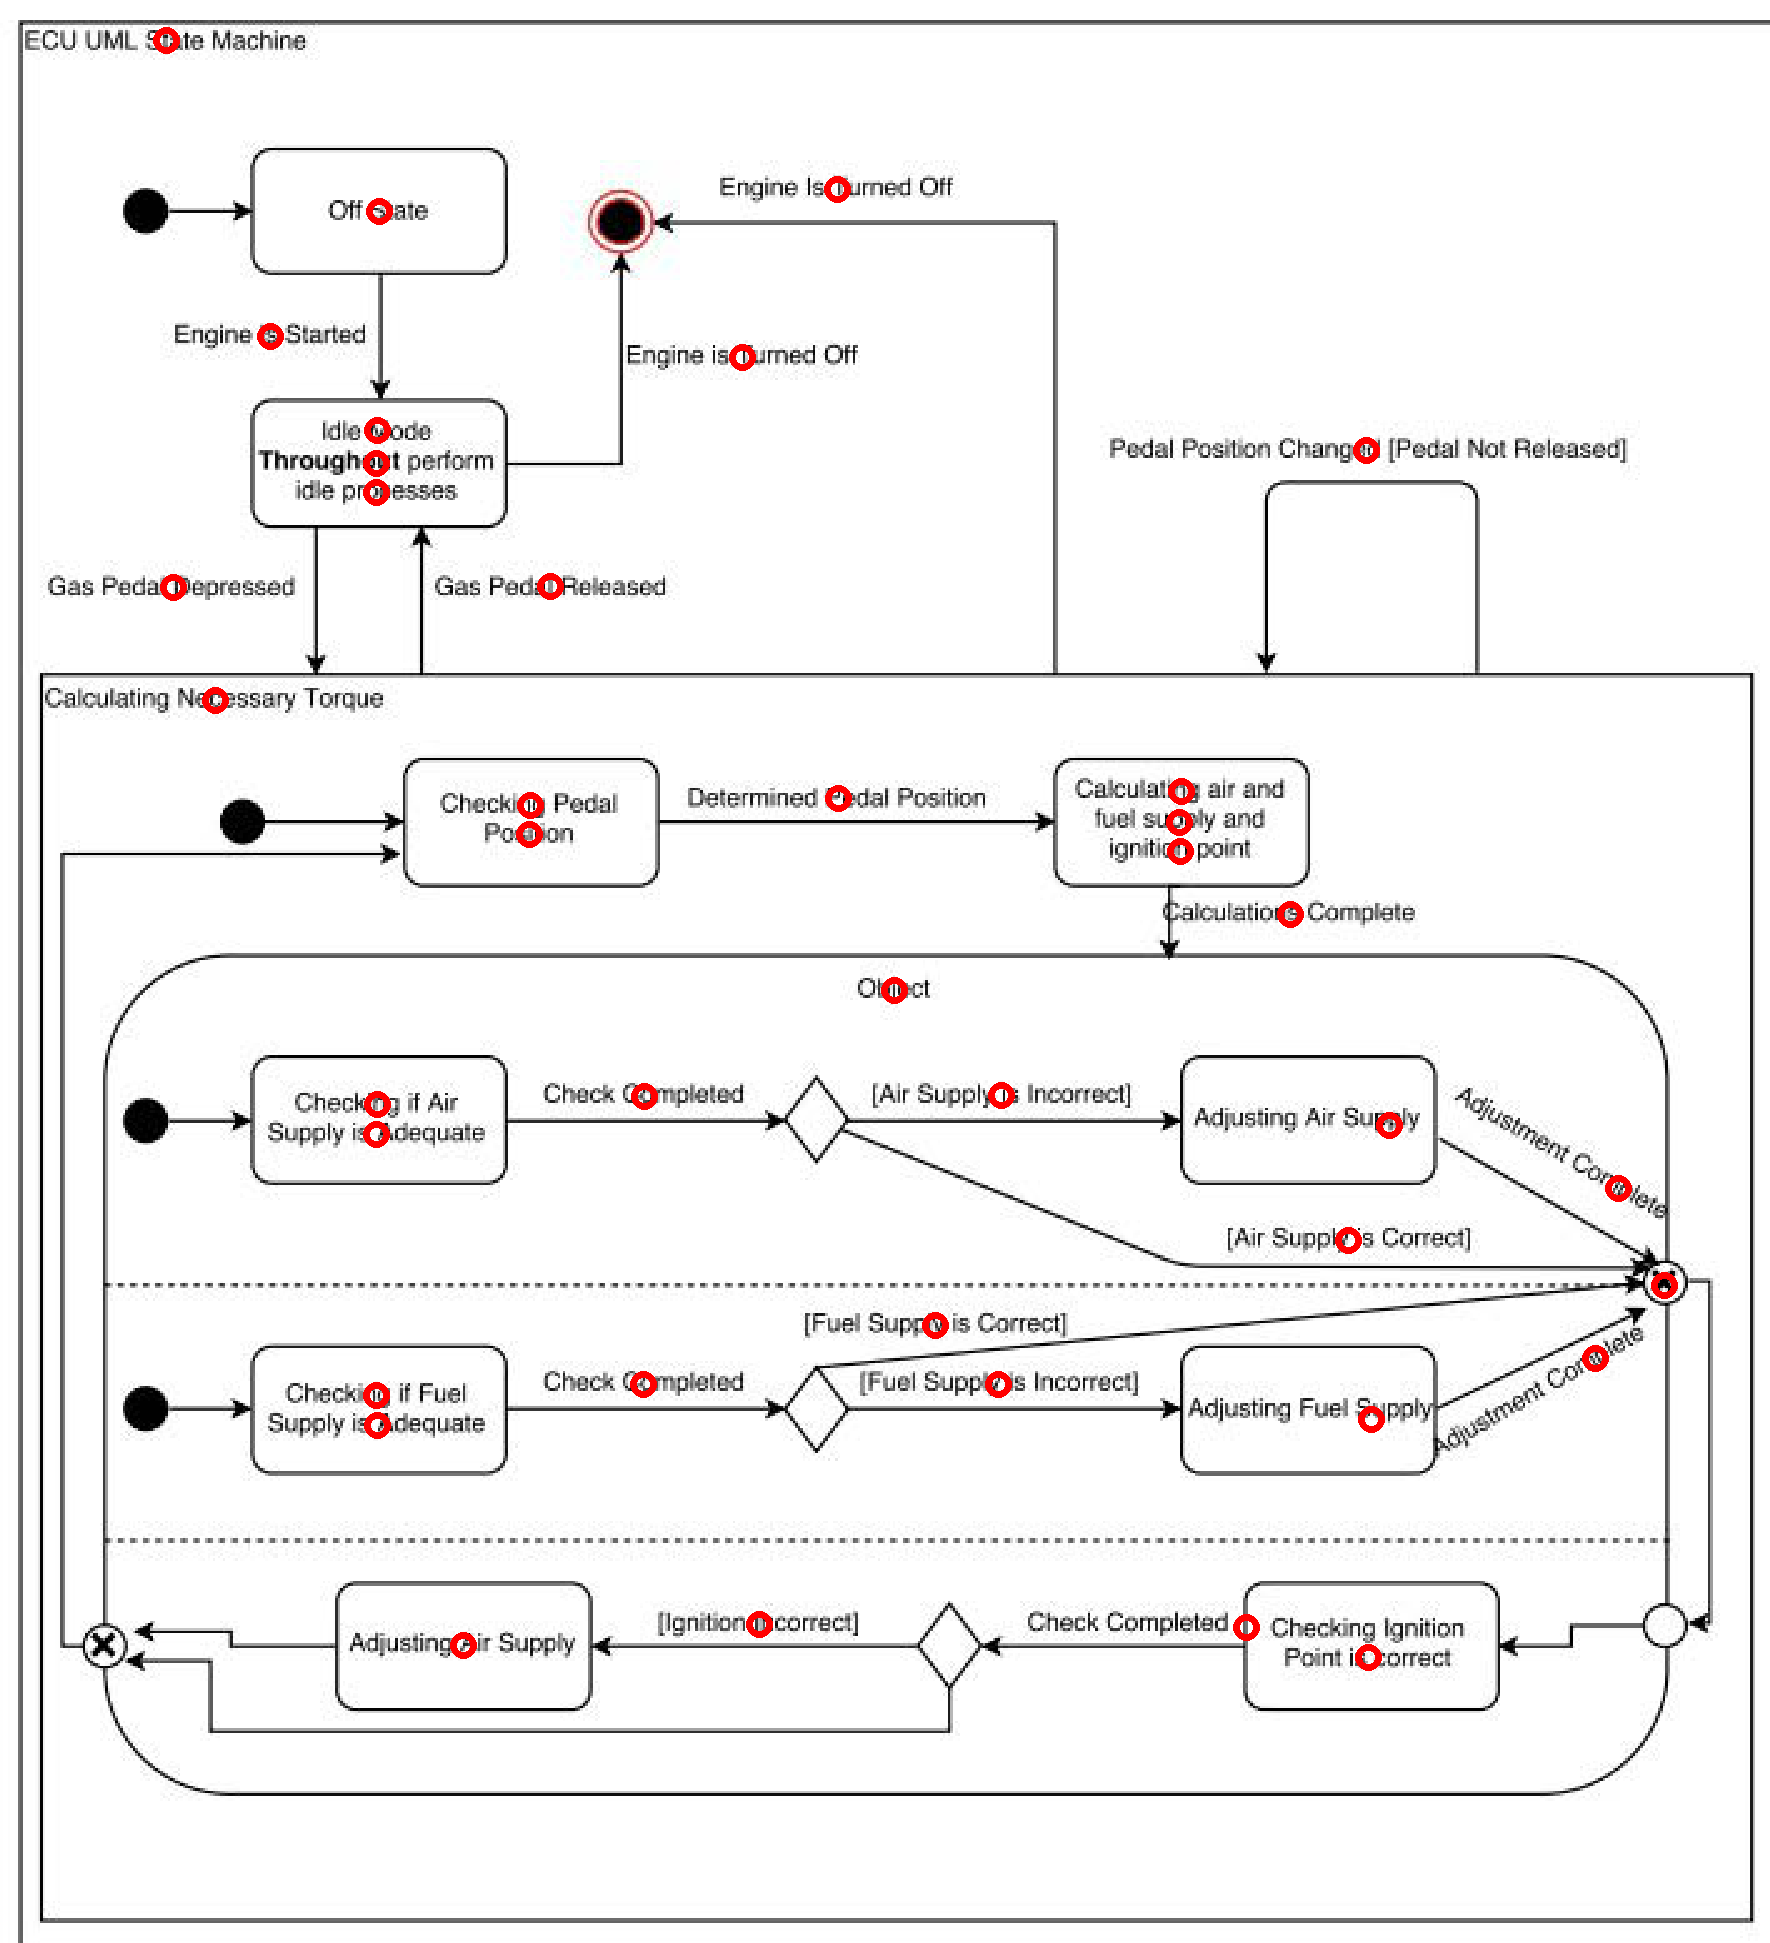 Example of the new OCR method output
Building a Reliable Fallback System
Recognizing that no OCR solution is perfect, I created a fallback method to detect text and boxes when OCR failed — typically on very large, low-resolution images. For this backup, I continued to use OpenCV, but with an improved technique: rather than relying solely on the findContours method, I first used open_cv getStructuralElement method, dilated these sections, and then applied findContours method. By filtering out especially small points (likely irrelevant artifacts), this method delivered much better and more accurate results when OCR alone wasn’t enough.
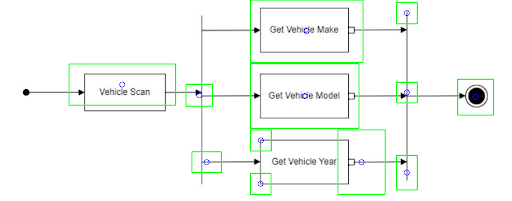 Example of the rollback method using Open_cv get structure method with post filter
Rethinking Clustering
Once we had improved our text and box detection methods, we realized that clustering was mostly unnecessary. The majority of our center point sets were already small, with a mean of 45 points and a median of 42 points. However, if a center point set exceeded 100 points — usually due to noise or irrelevant artifacts — we applied Mean Shift clustering to bring the data back into the expected range. Implementing this clustering was straightforward and helped maintain consistency across different diagram sizes. Mean shift clustering also did not rely on any outside information and can work with any UML diagram type.
 Left: original diagram, middle: new mean shift clustering, right: old k-means clustering
Squashing Bugs and Improving Accuracy
With the major system improvements complete, we turned to bug fixing — mostly small clarity issues, but two critical problems stood out:
- Distance Calculation Error: I discovered that my earlier distance filtering mistakenly excluded points sharing either the same x or y coordinate, instead of requiring both to match. This error led to unnecessary data loss, which we corrected.
- Voronoi Tessellation Fix: The Voronoi method itself wasn’t flawed — the issue lay in how I had defined the bounding box. After improving pixel counting across entire diagrams, we were able to generate accurate bounding boxes, dramatically improving Voronoi results.
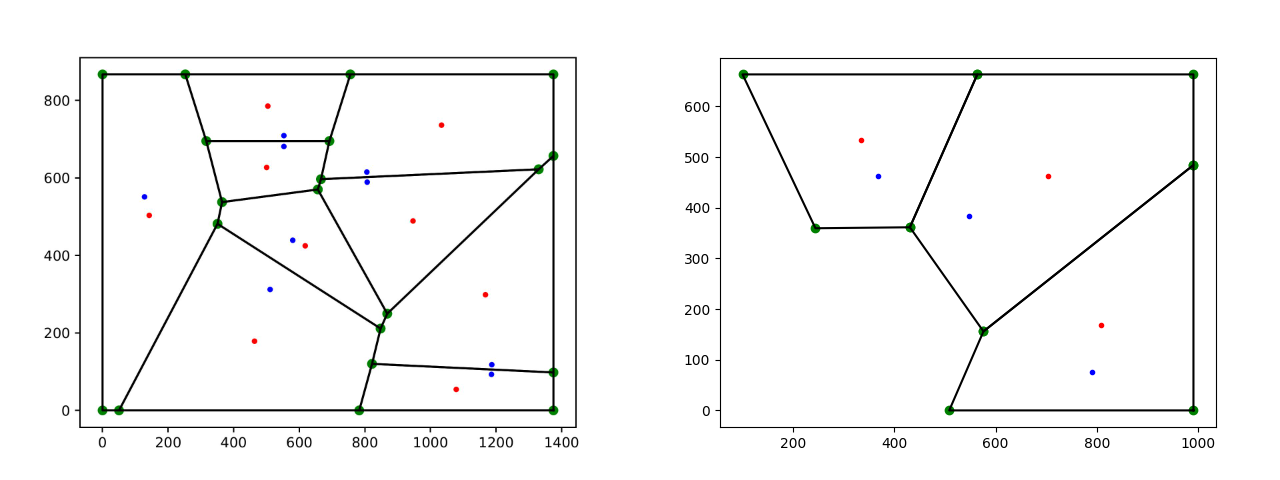 Output from the new and improved voronoi method
Step-by-step process
- For every pdf file it creates a png file
- For every png file it then runs an optical character recognition (OCR) method
- If the OCR returns less than 6 POIs it then runs an open cv method
- The algorithm then uses the method that returns the most POI’s.
- If the number of POI’s is larger than 100 it will use mean shift clustering to reduce the number of POI’s
- The data from the above steps is used in a custom voronoi method to find voronoi center points.
- These voronoi center points are used to calculate average distance, and standard deviation of the distances.
Putting It to the Test: Version 1 vs. Version 2
Our final step was to put the old and new versions through a head-to-head test to determine whether Version 2 was truly an improvement over Version 1. We designed a simple yet effective testing procedure: we manually selected 10 UML diagrams and randomly selected another 10, giving us a set of 20 diagrams to work with. Each diagram was first processed manually — following the procedure outlined in earlier research — to serve as our control group.
After establishing the control data, we ran both Version 1 and Version 2 on the same 20 diagrams and compared the results. We evaluated performance in two ways: visually, by examining the generated graphs, and quantitatively, by calculating the absolute error compared to the hand-done control method.
The results were clear:
Visually, Version 2’s graphs were significantly more accurate and easier to interpret than those from Version 1.
Quantitatively, Version 2 had a much lower absolute error, outperforming Version 1 by thousands of pixels.
This testing confirmed that not only was the Voronoi method necessary, but also that Version 2 was a significant upgrade. Perhaps most impressively, the failure rate for Version 2 was zero percent, compared to Version 1’s staggering failure rate of 22% (152 failed diagrams in total).
 Less blue better, more blue bad
Next Steps
I plan for the few remaining weeks to do three things
- Make this program a CLI tool that can be easily customized to fit all user needs
- Create proper documentation and JAVA docs such that future researchers can use this program and maintain it without needing to decipher it
In the next few weeks I plan to complete these features, and will make a further update post when I complete them
Conclusion
Through careful redesign, collaboration, and relentless testing, we transformed this project from a rough prototype into a highly accurate and reliable tool for analyzing UML diagrams. By pivoting to better libraries, refining our detection and clustering methods, and thoroughly validating our improvements, Version 2 doesn’t just meet expectations — it exceeds them.
With zero failures, dramatically lower error rates, and cleaner, more maintainable code, this new version stands as a strong foundation for future growth. And with a few new features already on the horizon, and future research still needed to be done!
Author Notes
This program has been in development since August 2024, and finally seeing it reach the level of quality and reliability I always believed was possible is incredibly rewarding. More than just a technical project, this journey has been a huge learning experience — pushing me to dive deep into new libraries, tools, and algorithms, and challenging me to find creative solutions to problems that, at first, seemed impossible.
Along the way, I learned that even when faced with an abstract, messy problem without a clear path forward, I could build something real, effective, and lasting. This work is more than just code — it’s a reflection of the skills I’ve developed and the growth I’ve experienced throughout this project.
As I wrap up my time with this research lab and the Model Comprehension project, I’m proud to leave behind something that, I hope, will be useful for future student researchers and for Professor Dr. Bastian Tenbergen. It’s bittersweet to move on, but I’m excited to see how the next generation will take this work even further.